 semper
Running an analysis
From loading frames through ROI, parameters, and Compute.
Three steps: load your frames, choose an area and settings, then Compute. Everything else is detail on those three.
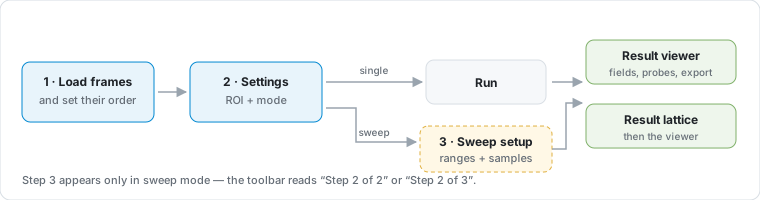
Step 1 — Load frames
In the app: tap each dropzone and pick images.
Photos is the system picker. Files is the only path to RAW and DNG (and to picking a video — see Getting started).
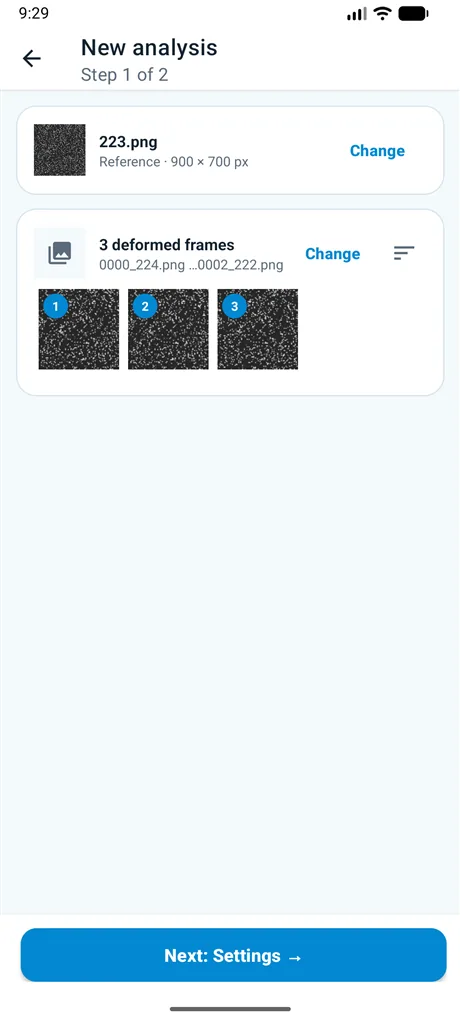
Why it matters: the number badge on each deformed frame is its order, and that order is used everywhere afterward — frame 1 here is frame 1 in every result and export.
Getting the order right
Tap the sort icon to reorder. There is no way back to the picker's original order once you sort, so set it before you Compute. (With a single deformed frame the control is hidden.)
| Sort | Use when |
|---|---|
| Name · A–Z / Z–A | Filenames carry the sequence |
| Date · oldest / newest | Filenames don't — uses capture time, then EXIF |
| Manual | Neither works — drag the thumbnails into order |
Step 2 — Settings
- Region of interest — defaults to the full image. Edit opens the ROI editor.
- Single or Sweep — Single solves every frame once. Sweep solves one frame across many parameter combinations.
- Advanced parameters — subset, step, strain window, kernel. If you copied a combination from a sweep lattice, a Paste params chip appears beside Reset and fills all three in one tap (the screen scrolls them into view).
Then tap Compute.
While it runs
Points solved and convergence update live.
Cancel stops at once — nothing is kept. Keep the app open; there is no resume if the system stops the app while it works.
If it fails outright: see Troubleshooting · during a run for the exact messages and what each means.
Parameters (single mode)
The two you actually tune: subset (how big a patch each point matches) and strain window (how much the strain is smoothed). The defaults are sensible — the app even recommends a subset from your image.
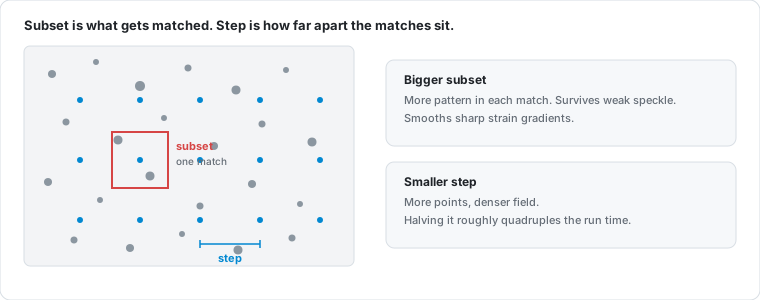
| Parameter | Range | Default / reset |
|---|---|---|
| Subset size | 15–121, odd | Recommended from your image |
| Step size | 1–30 | 5 |
| Strain window | 5–101, odd | 15 |
| Kernel | 4×4 Bicubic / 6×6 Keys | 4×4 Bicubic |
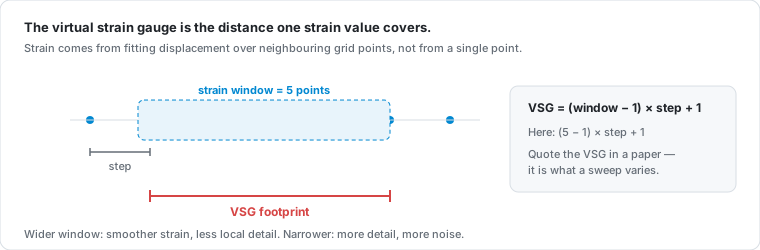
Full table with when-to-raise / when-to-lower: Parameters.
Region of interest
Draw a box over the part of the image you want measured; erase holes over anything that would spoil the match, like grips or markers.
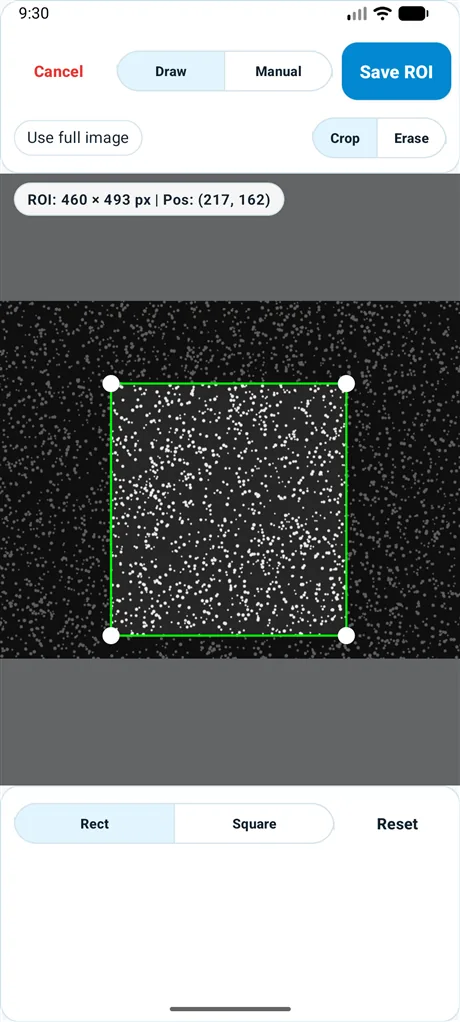
Draw — pick Rect or Square and drag on the image; drag inside to move, corners to resize, with size and position shown live. Manual — type X, Y, W and H exactly and Apply. Crop sets the area to correlate; Erase punches holes in it.
If it fails: an ROI smaller than the subset will not run — enlarge the ROI or shrink the subset.