 semper
Sweeps & results
Why to sweep, how to read the lattice, and how to inspect field maps.
Why sweep
A sweep re-solves one frame at many smoothing settings, so you can pick a strain value that holds steady instead of one that just happens to fall out of a single setting.
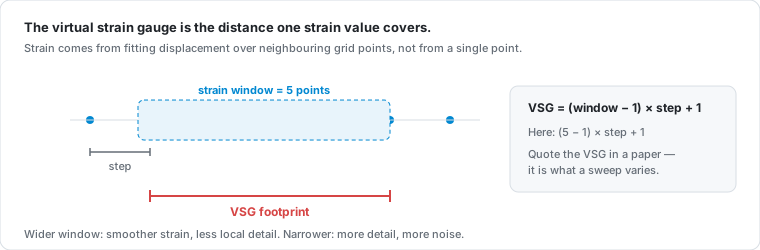
Strain is computed from displacement, so it depends on how much you smooth. A small virtual strain gauge (VSG) keeps peaks but adds noise; a large VSG smooths peaks away. A sweep solves one deformed frame across many subset × window combinations so you can see where the answer stops changing.
Why it matters: good DIC practice asks you to show that reported strain is not an accident of one VSG choice.
Setting up a sweep
In the app: on step 3, set ranges and sample counts.
| Control | Range |
|---|---|
| Subset range | 15–121, odd |
| Strain window range | 5–101, odd |
| Step denominator | 2–9 (step = subset ÷ n, never below 1 px) |
| Samples per axis | 1–8 (runtime is the product) |
Start at 3 × 3. The sweep varies the strain window directly; VSG is still
what you quote — it is shown per node — but it is derived
((window − 1) × step + 1). Look for the VSG where the curves stop separating.
Result lattice
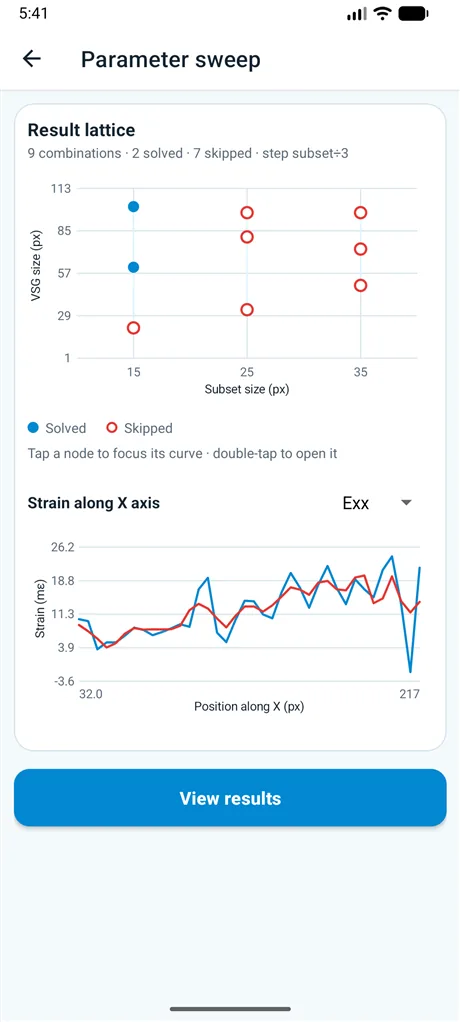
The screen is built for one thumb: lattice, then controls, then the plot scroll together, while Save graph and View stay pinned at the bottom.
Choosing a combination
- Tap a node, or use the ‹ · › stepper above the plot to walk solved nodes. The chip between the arrows names the current one.
- Double-tap or long-press a node — opens that result. So does View.
- Tapping a hollow node explains why that combination was skipped.
Reading the plot
- Isolate (default) shows only the selected combination. Highlight draws all of them, with the selected one at full strength.
- Drag across the plot — a guide follows your finger and prints the value. The scrub slider under the plot does the same and stays in sync (easier one-handed).
- Pinch to zoom, two-finger drag to pan, double-tap to reset zoom. Zoom survives stepping to another node; changing Exx / Eyy / Exy resets it.
- The Exx / Eyy / Exy selector switches component.
Taking the answer with you
- Double-tap the readout to copy that combination's subset, step and strain window. Start a new single-setting analysis and a Paste params chip on step 2 fills them in.
- Save graph writes an annotated PNG: study header, fit-to-data plot, and a colour legend. On-screen zoom is not baked into the file.
If every combination fails, you still land on the lattice (all nodes hollow). View and Save graph are disabled until something solves.
Reading results
The viewer opens on a looping animation of the whole sequence, then lets you step through frame by frame and probe individual points.
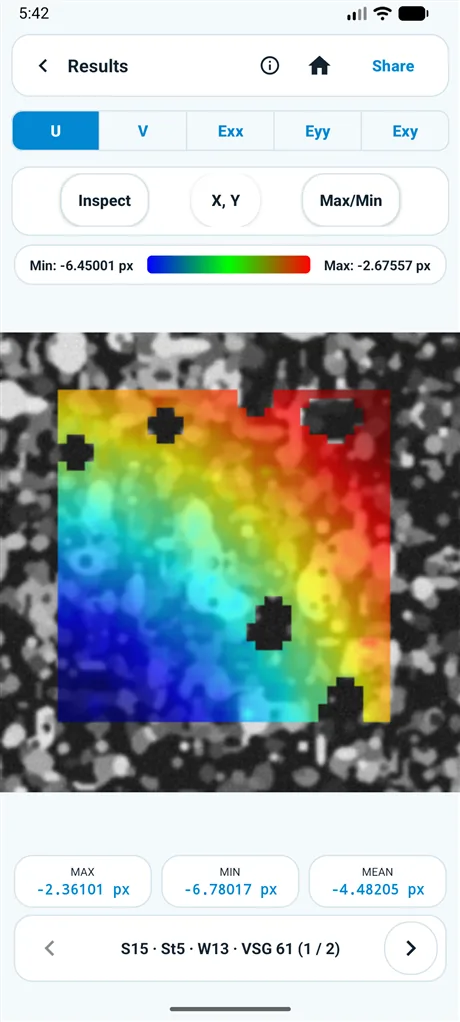
Tabs switch the field. Pinch to zoom, drag to pan; both survive a field change. The strip under
the image shows max, mean, and min. Next enters the individual frames;
Prev on frame 1 returns to the animation. Type a number in the small field and
press Go to jump straight to a frame — useful at 150 frames. On a sweep each
frame is a parameter combination, labelled like S15 · St5 · W13 · VSG 61.
Why it opens on an animation
In the app: the colour scale defaults to Auto, which rescales every frame on its own — so a late frame can look exactly like an early one, and frames are not comparable by eye when you scrub.
The summary animation fixes this: it puts every frame on one colour scale — the range covering the whole sequence — which is the honest way to watch strain grow. To compare frames yourself, tap the scale bar and set a fixed min/max instead.
| Tool | Does |
|---|---|
| Inspect | Probe location and value under your finger |
| X, Y | Jump the probe to typed coordinates |
| Max/Min | Mark extrema with values and positions |
The ⓘ Settings used sheet is provenance. Changing settings later never rewrites an old result.