Five sets of real test images with known answers. Run one before your own lab, or check your settings against it.
Every set is also inside the app. In the Semper Classroom app,
open Settings → Help → Example data (or + → Try an example).
Try it starts an analysis with the files already in; Save to phone
copies the set to Download/Semper examples/. The files on this page are the same ones.
The sets are not ours. Each keeps its authors' licence: three are
CC BY 4.0 and two come from
DICe under the BSD-3-Clause licence. You may copy, share and adapt
them under those licences; nothing on this site or in the app adds a limit. If you share
them, keep the credit, and for the DICe sets the licence text. Every zip carries its notice:
CREDIT.txt, plus LICENSE.DICe for the DICe sets. All sets are
provided as is, without warranty of any kind.
Where a set gives two answers, the headline is the dataset's own measurement. The
"App, earlier run" column is what the app gave on an earlier version; a newer version may
differ slightly.
Steel strip in tension
Tensile
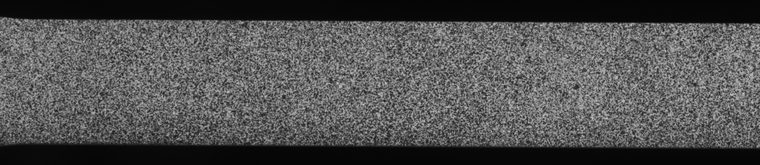
Reference frame steel_00.png, downscaled.
Real photos of a 12.5 mm × 1 mm stainless-steel strip (1.4016) pulled to failure, with the
machine's force at each photo. It gives a stress–strain curve and Young's modulus. This is
camera 1 of the authors' stereo DIC test.
Steps
New analysis → Tensile.
Reference steel_00.png; deformed frames steel_01 to steel_40.
Load log steel_loads.csv, units kN (40 rows, 40 frames).
Area 12.5 mm², load axis x.
ROI: the whole specimen band. Accept the suggested subset (19 px), step 5 px, strain window 5 points.
Compute, then ⓘ → Results, and Share → Lab report (PDF).
Expected
The dataset's own measurement
App, earlier run
E, frames 1–26 (6.5–238.8 MPa)
157.5 GPa (two gauge points 60 mm apart, tracked in 3D)
148.9 GPa, R² 0.9952 (engine 0.6.1; 35 of 40 photos on the curve)
Peak stress
435.5 MPa at frame 38 (step 509)
435.5 MPa, frame 38 (off the curve: no strain there)
Both sit below the handbook value for this steel (about 220 GPa); that is usual for camera and
gauge-point measurements at strains under 1.7 mε. One camera viewing the strip at an angle reads
a few per cent lower still. The authors' gauge-point strain at every frame is in
truth_gauge_strain.csv.
Credit and licence
Source
Sanjeev Koirala, Tensile test of steel specimen using digital image correlation, Zenodo, 2026.
Camera 1 of the stereo pair only. 41 of the 751 load steps kept (0, 3–30, 35, 40, 45, 55, 80, 130, 205, 305, 405, 509, 605, 705). Each photo cropped to the specimen band, (0, 780)–(2000, 1215), and saved as 8-bit PNG. The force at those steps written to steel_loads.csv (kN), and the gauge points' strain to truth_gauge_strain.csv. The picture above is the reference frame, downscaled.
No endorsement by the authors is implied.
Files
Our prepared set is 21 MB, too large to host here. It is inside the Semper Classroom app
(Settings → Help → Example data). The complete original dataset is on the original record at Zenodo.
PMMA beam in 3-point bending
Bending
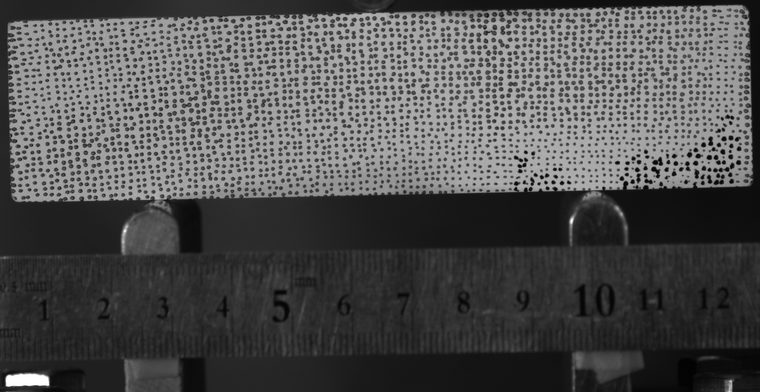
Reference frame pmma_00.png, downscaled.
Real photos of a speckled acrylic beam on two pins, pushed down at mid-span at 2 mm/min until it
breaks, with the load cell's force at each photo. The frames are cropped the way you would film
it: the beam across the full width, in the top half. It gives the deflection, the bending stress
and E. Span 75 mm, depth in view 31 mm, thickness 12 mm.
Steps
New analysis → Bending.
Reference pmma_00.png; deformed frames pmma_01 to pmma_33.
Load log pmma_loads.csv, units N (33 rows, 33 frames).
L 75 mm, b 12 mm, t 31 mm.
Mark load point under the nose, x ≈ 1170 px: tap the top edge (y ≈ 39 px) and the bottom edge (y ≈ 611 px). The readout should say about 572 px, 0.054 mm/px. Zoom in: every 6 px of error moves E by about 1%.
ROI: the speckled beam only, off the pins, the ruler and the nose. Accept the suggested subset. Compute.
The dataset values come from the authors' own 3D DIC: their vertical displacement averaged over
the circle the app probes (the load point, mid-depth, radius t/2), in
truth_deflection.csv. The handbook E for PMMA is 2.4–3.3 GPa; this beam is deep
(span 2.4 × depth), so shear adds deflection and the simple beam formula reads E low. Near the
peak the curve bends over as PMMA softens before it breaks.
Credit and licence
Source
I. Tabiai, R. Delorme, P. Diehl, L. Laberge Lebel, M. Lévesque, PMMA 3 point bending test until failure loaded in displacement, Zenodo, 2018.
Camera 0 of the stereo pair only. Image 32 (the reference) and every second image from 33 to 97 kept. Each cropped to (40, 820)–(2420, 2048) and saved as 8-bit PNG. The load cell's force at those images written to pmma_loads.csv (N); frame_index.csv maps each file to its original image; truth_deflection.csv is the authors' deflection at the load point, averaged over the probe circle the app uses. The picture above is the reference frame, downscaled.
No endorsement by the authors is implied.
Files
Our prepared set is 52 MB, too large to host here. It is inside the Semper Classroom app
(Settings → Help → Example data). The complete original dataset is on the original record at Zenodo.
Concrete beam (expected to fail)
BendingExpected to fail
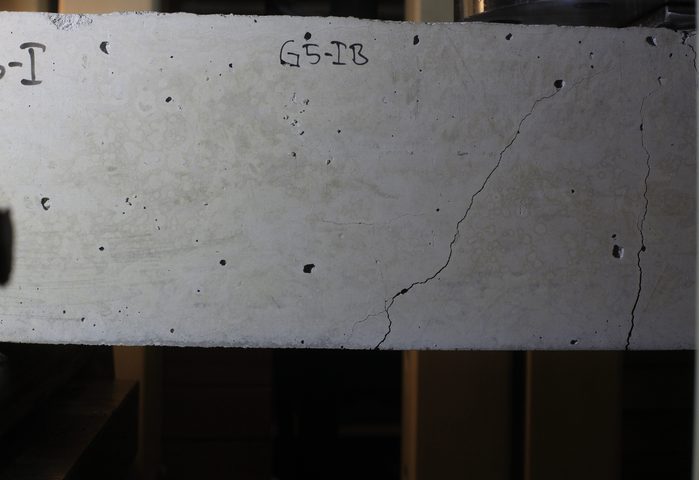
Reference frame concrete_00.jpg, downscaled.
Real photos of a 150 × 150 × 800 mm cracked reinforced-concrete beam, loaded at mid-span by a
hydraulic piston that pauses at 10, 20, … 60 kN for a photo. The app cannot analyse this
set. The concrete is mostly smooth grey, with too little texture to track, so the run
stops early. Keep it as an example of photos that don't work: if your specimen looks like this,
paint a speckle pattern on it first.
Steps
New analysis → Bending.
Reference concrete_00.jpg; deformed frames concrete_01 to concrete_07.
Load log concrete_loads.csv, units kN (7 rows, 7 frames).
L 700 mm (a placeholder: the support span is not published), b 150 mm, t 150 mm.
Mark load point under the piston, x ≈ 1800 px: top edge y ≈ 40 px, bottom edge y ≈ 1180 px.
ROI (Manual): x 60, y 70, 2250 × 1080, the concrete face only. The speckle check warns that contrast is low. Compute.
Expected
What happens
Result
Stops early after frame 2 ("Stopped early")
Why
Only 41% of the points were tracked in frame 1; the app stops when two frames in a row track fewer than half
"Stopped early" is the app refusing to give a wrong answer. The set's README.md
explains the match score it needs and why no subset the app allows gets this concrete through.
The beam was already cracked, so even a tracked run would not give a meaningful E.
Credit and licence
Source
A. Sjölander, V. Belloni, V. Peterson, J. Ledin, Monitoring of structural performance of cracked reinforced concrete using DIC and CMfM, Mendeley Data, v3, 2023. Described in Data in Brief 51 (2023) 109703.
Beam 5, fixed camera IB only. Eight photos kept: the start of the test and the pauses at 10–60 kN. Each cropped to (600, 480)–(5350, 3744), halved to 2375 × 1632 px and saved as JPEG quality 95. The force at each pause written to concrete_loads.csv (kN); frame_index.csv lists each photo's time, force and piston displacement. The picture above is the reference frame, downscaled.
Eight JPEGs, the load log, frame_index.csv, README.md and
CREDIT.txt. The complete original is on the
original record at Mendeley Data.
Carbon-fibre plate with a hole
2D DIC
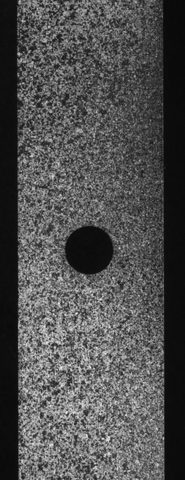
Reference image oht_cfrp_ref.tiff, downscaled.
Two images of an open-hole tension specimen of carbon-fibre composite, from the test data of the
Digital Image Correlation Engine (DICe), Sandia National Laboratories: the first load step and
the next. 400 × 1040 px, 8-bit, no load log. The plate is pulled along y, so v changes along the
plate and the hole concentrates strain beside it. Compare your field with DICe's own solution.
ROI: the plate, about x 40–360, y 40–990 px. Subset 27 px and step 35 px match DICe's own run.
Compute, then look at V and Eyy.
Expected
DICe's solution (230 points, 35 px grid)
Median v
−0.63 px (from −0.92 to −0.39)
Median u
−0.10 px
Median eyy
+0.48 × 10⁻³
DICe's point-by-point field is in DICe_solution_01.txt (x, y, u, v and strain).
Credit and licence
Source
Digital Image Correlation Engine (DICe), Sandia National Laboratories, test images oht_cfrp_00.tiff and oht_cfrp_01.tiff, and the solution file DICe_solution_01.txt. Copyright 2015 National Technology & Engineering Solutions of Sandia, LLC (NTESS).
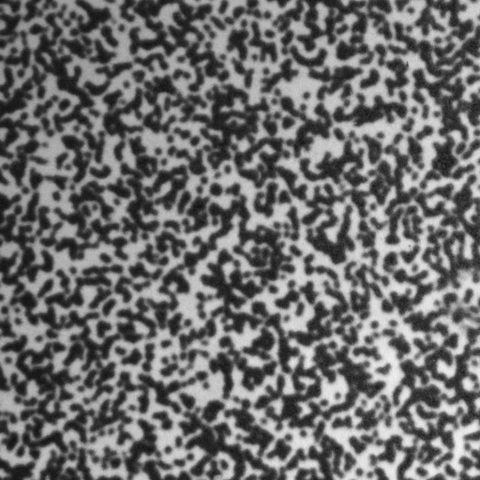
Nothing in the images; oht_cfrp_00.tiff and oht_cfrp_01.tiff renamed oht_cfrp_ref.tiff and oht_cfrp_def.tiff. The picture above is the reference image, downscaled.
Both images, DICe_solution_01.txt, README.md, CREDIT.txt
and LICENSE.DICe. Original: the DICe repository on GitHub.
Sub-pixel shift
2D DIC
Reference image translation_ref.tif, downscaled.
A speckle image and a copy of it shifted by 0.4 px, from DICe's test data. 512 × 512 px, 8-bit.
Every point moved by the same known amount, so it tests how closely the app finds a shift
smaller than one pixel. translation_def.tif holds a second page; the app reads the first, the
shifted one.
0.4 px everywhere (DICe's own test accepts |u − 0.4| ≤ 0.1 px)
Strain
0: any strain shown is the app's noise on a near-perfect image
Credit and licence
Source
Digital Image Correlation Engine (DICe), Sandia National Laboratories, custom_app test images ref.tif and def.tif. Copyright 2015 National Technology & Engineering Solutions of Sandia, LLC (NTESS).
The two DICe sets, and their pictures on this page, are shared under this licence:
Digital Image Correlation Engine (DICe)
Copyright 2015 National Technology & Engineering Solutions of Sandia, LLC (NTESS).

Under the terms of Contract DE-NA0003525 with NTESS,
the U.S. Government retains certain rights in this software.

Redistribution and use in source and binary forms, with or without
modification, are permitted provided that the following conditions are
met:

1. Redistributions of source code must retain the above copyright
notice, this list of conditions and the following disclaimer.

2. Redistributions in binary form must reproduce the above copyright
notice, this list of conditions and the following disclaimer in the
documentation and/or other materials provided with the distribution.

3. Neither the name of the Corporation nor the names of the
contributors may be used to endorse or promote products derived from
this software without specific prior written permission.

THIS SOFTWARE IS PROVIDED BY NTESS "AS IS" AND ANY
EXPRESS OR IMPLIED WARRANTIES, INCLUDING, BUT NOT LIMITED TO, THE
IMPLIED WARRANTIES OF MERCHANTABILITY AND FITNESS FOR A PARTICULAR
PURPOSE ARE DISCLAIMED. IN NO EVENT SHALL NTESS OR THE
CONTRIBUTORS BE LIABLE FOR ANY DIRECT, INDIRECT, INCIDENTAL, SPECIAL,
EXEMPLARY, OR CONSEQUENTIAL DAMAGES (INCLUDING, BUT NOT LIMITED TO,
PROCUREMENT OF SUBSTITUTE GOODS OR SERVICES; LOSS OF USE, DATA, OR
PROFITS; OR BUSINESS INTERRUPTION) HOWEVER CAUSED AND ON ANY THEORY OF
LIABILITY, WHETHER IN CONTRACT, STRICT LIABILITY, OR TORT (INCLUDING
NEGLIGENCE OR OTHERWISE) ARISING IN ANY WAY OUT OF THE USE OF THIS
SOFTWARE, EVEN IF ADVISED OF THE POSSIBILITY OF SUCH DAMAGE.

Questions? Contact: Dan Turner (dzturne@sandia.gov)
 semper